Performance based service allocation algorithms
Summary of the statistics
We are collecting disk performance statistics from all the servers to analyze how they are performing. For performance as Seedbox there is 2 major factors: Network and Disk performance.
Today we have implemented disk performance statistics based allocation algorithms. Some months ago we detailed as we started collecting this data systematically.
This takes disk bandwidth utilization % and service time (how fast requests are served) and use this to adjust provisioning. We use values of day, weekly and monthly averages to adjust this. Day stats gives the weakest effect, while monthly gives the largest.
Every operation to a disk drive (magnetic or SSD) is an Input / Output Operation, and it takes time; Hence we can monitor the performance of Input / Output Operations Per Seconds (IOPS), Time it takes (service time) and total data throughput in Megabytes per second.
SSD drives are faster, but it’s hard to push them at their limits constantly due to low capacity. More storage on the SSD plans ought to fix that! 😉 The other thing this means as well is very high quality of service. You have always the performance you need at your fingertips. You are no more limited to what happens to be the load currently on that particular server.
Our own Espoo nodes compared to dedicated servers available on the market: They are simply in completely different league! Very few dedicated servers on the market come even close to the disk I/O performance figures we have from our own nodes, whether RAID0, RAID5 or RAID10. Despite the hardware we use is mostly couple generations old, it was absolutely top of the line at their release date, pretty much being The Best Money Can Buy, at the time. We use proven setups, and relatively small server sizes to keep the highest performance per € achievable.
Performance I/O statistics as part of new service allocation
We take this data, and utilize it on both sides of the equation: As a deprioritizing component and adding priority. A server where I/O requests are being served on average 2ms will have much higher priority than that which takes an average of 15ms. Further, if service time or bandwidth utilization percentage exceeds a given threshold there will be no further accounts provisioned on that server until situation is resolved.
Now, wait a minute, disks have usually 7.9 to 8.9ms seek time, right? Average seek time, and that does not account for read ahead and other queuing magic the firmware does, ie. if head needs to move from track 1 to track 500 for I/O request #1, it looks on the queue and on the way picks up I/O requests on the middle tracks. It is also possible kernel file cache is “below” the disk iostat metrics, ie. if requested data is in RAM it affects the numbers as well.
We gather the current statistics every few hours, and the data is generated shortly after. This let’s us to react to spikes as well, which do happen; Especially times like Black Friday, so many got put into a single server that no one was having fun on that server for weeks to come! That server was doing brilliantly on overall stats, but per user it was a weak show as so many were added in the time span of couple of days, resulting everyone racing to fill their quota immediately – which results in everyone trying to write to drives at maximum speed. Overally tho, the server never skipped a beat, took it like a champ and never dropped below 25MB/s upload speed – not even once, all the while constantly keeping up very high download rate. Infact, it’s still averaging daily over 200Mbps upload speeds (as displayed by vnstat), more than a month later (5 drive RAID5, 1Gbps connection).
Fun Facts of Performance!
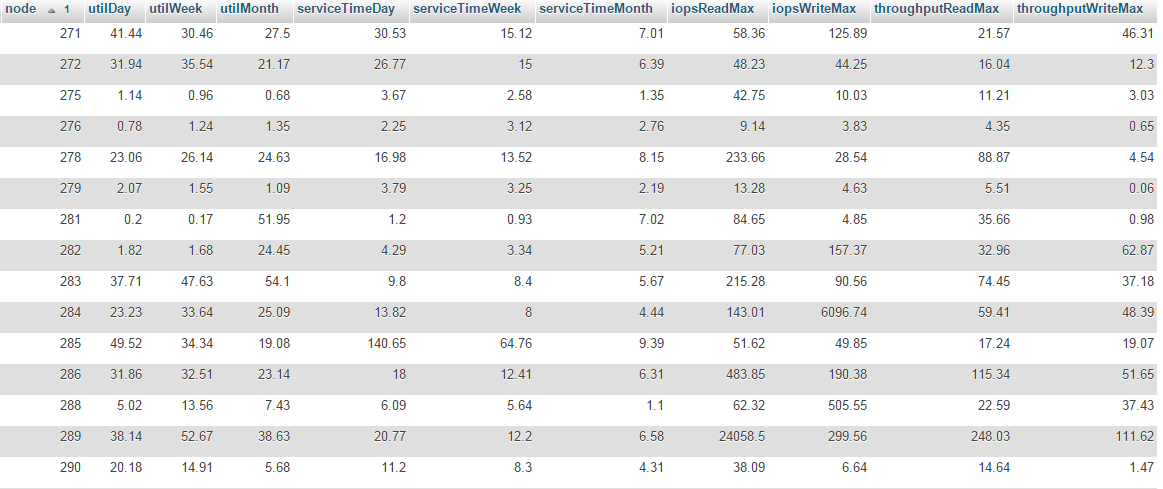
These are 120second averages, as seen on the past 2 months. Note that these statistics are as how the linux kernel sees it, and most likely are taken above all but I/O request merging optimizations, so RAM, Drive firmware, Queuing discipline etc. affects these figures. The utility is called iostat and comes in sysstat package in Debian systems.
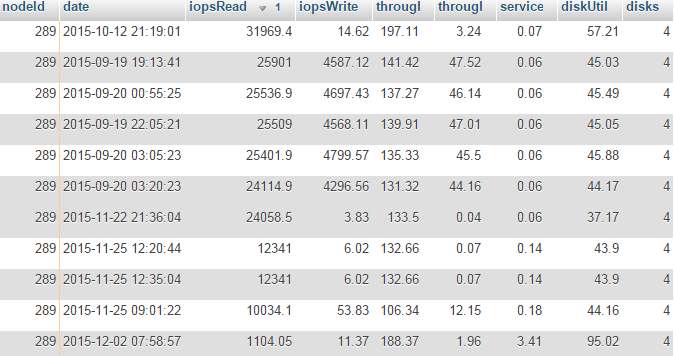
Highest IOPS Read average we have seen is 24 058 IOPS (!!) and it’s magnetic drives! A testament to queueing and caching – the physical platters ought to have maximum of only 480 IOPS – So the rest is all about caching & optimizations. These numbers got to be fluke, yes? That’s what we thought at first as well! We drilled down on the raw data and figures, and this wasn’t even a special case one time thing, or only this server. We are assuming this is due to software raid causing a massive amount of tiny I/O requests which happens to be optimal for optimizations. Disks have onboard cache and firmware to optimize, as well as does the linux kernel.
Infact, it’s the 5th position until we see the first SSD Node – *VERY* Surprisingly with just 1714 read IOPS peak. Top 4 are magnetic drives with an average of 9629 read IOPS.
IOPS Write peak is 535. Highest SSD did not fit into TOP 25, but hold on – that might be because of the lower capacity sustained writes tend to be much shorter.
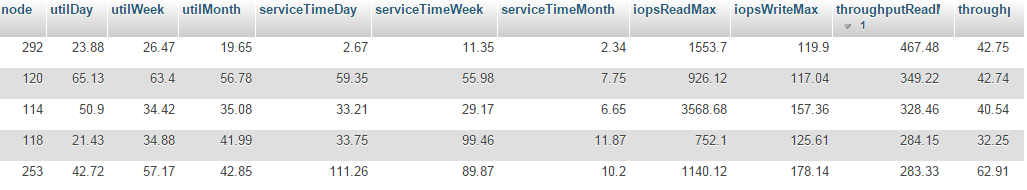
Node #253 is probably having UI slowdowns already as well – so provisioning to this server is disabled at the moment.
Read Throughput max is 467MiB/s – SSD Server ranking #1. Next highest is 349MiB/s which is one of our Espoo 4x3TB servers.
Write Throughput max is 155.91MiB/s and is one of our Espoo 4x8TB Seagate Archive drive servers! This server also has read peak of 104.3MiB/s and IOPS Read: 403, Write: 387 and weekly average service time is 15.74ms.
Low performance, eh? The most common criticism on the Seagate Archive disks is that they are slow. We are simply not seeing that in the stats. Seriously, statistics of the nodes we have tell a totally different story of these drives.
Averages? Global weekly averages across all servers are: BW Util 24.85%, Service time 13.53ms, IOPS Read Max 415, IOPS Write Max 128, Throughput Read: 57.7MiB/s, Throughput Write: 29.34MiBs
Sorry, we did not include average # of disks in the stats yet, but we estimate it is somewhere around 3 drives on average.
Conclusion
This data shows us ways to optimize and what server & disk models to pick, instead of just using it as a means to better allocate users prioritizing less used servers.
Beyond that, this allows us to sometimes catch a potential disk failure early (node #285 in earlier figure as an example) – and that’s just what we did immediately when this data was available.
We will keep drilling in the data and distilling it to gain more insight how the servers function – and this gives us more ways to optimize and increase quality of service.
Update 5.1.2016: Moved summary as the intro of this posting, and added basic information to help understanding the remainder of this topic, and other reformatting. Added screenshot of the SSD node #292 disk performance